PyGeom2D is a Python library I created to help with some personal projects. Just in case it can be helpful to others, I’ll add PyGeom tutorials in this blog from time to time 🙂
In this tutorial we’ll cover the basics: how to create points and lines. As you’ll see it is pretty straightforward.
Step 1
Download PyGeom from Github: https://github.com/NaysanSaran/pyGeom2D.
You just need to copy the pygeom directory in the same directory where you’ll write your code.
Step 2
Create your first points and lines
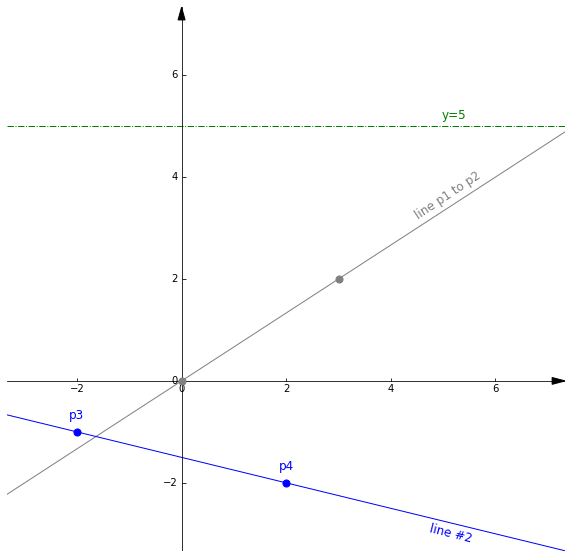
from pyGeom2D.pygeom import Axes, Point, Line

# Create the cartesian axis
axes = Axes(limits=(-3,7), size=10)

# A grey line between two points p1 and p2
p1 = Point(0, 0, color='grey')
p2 = Point(3, 2, color='grey')
l1 = Line(p1=p1, p2=p2, label='line p1 to p2', color='grey')
axes.addMany([p1, p2, l1])

# A blue line between two points p3 and p4, this time give the points a label
p3 = Point(-2, -1, color='blue', label='p3')
p4 = Point( 2, -2, color='blue', label='p4')
l2 = Line(p1=p3, p2=p4, label='line #2', color='blue')
axes.addMany([p3, p4, l2])

# This time define a green line with a slope and intercept
l3 = Line(slope=0.0, intercept=5.0, label='y=5', color='green', linestyle='dashdot')
axes.add(l3)

axes.draw()
Et voilà!