New PyGeom Tutorial! How to draw curves from functions. Because we must be at least tens of people out there who want to do visual 2D mathematics in Python…right?
Step 1: Get PyGeom
- You can clone my Pygeom repository directly from GitHub: https://github.com/NaysanSaran/pyGeom2D
- Then all you need to to is to copy the pygeom directory where your code/notebooks will be
Step 3: Create your functions and draw them
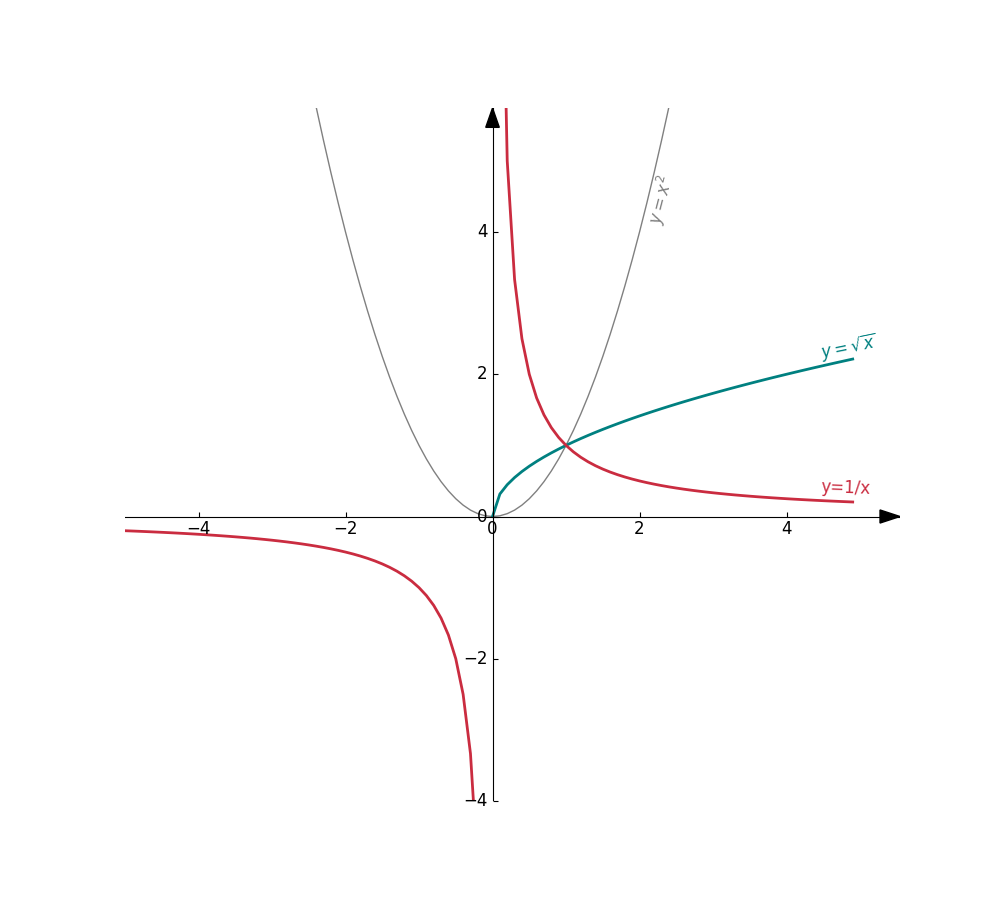
It is pretty straightforward from there. Let’s create three functions for testing:
$$f(x) = x^2; \quad g(x) = \sqrt{x}; \quad h(x) = \frac{1}{x}$$
The entire code + results is shown below
import math
import numpy as np

from pygeom import Axes, Point, Curve

def f(x):
    y = math.pow(x, 2)
    return y

def g(x):
    if x < 0:
        y = np.nan
    else:
        y = math.sqrt(x)
    return y

def h(x):
    y = 1/x
    return y


# Create the cartesian axis
axes = Axes(xlim=(-5,5), ylim=(-4,5.2), figsize=(10,9))

# Curve of y = x^2
c1 = Curve(f, label=r'$y=x^2$', color='grey')
axes.add(c1)

# Curve of y = sqrt(x)
c2 = Curve(g, label=r'$y=\sqrt{x}$', linewidth=2, color='#008080')
axes.add(c2)

# Curve of y = 1/x
c3 = Curve(h, x_disc=[0.0], label='y=1/x', linewidth=2, color='#ca2c40')
axes.add(c3)

axes.draw()