
I couldn’t find a library to draw simple state transition diagrams for Markov Chains in Python – and had a couple of days off – so I made my own. The code only works with 2 to 4 state transition matrices, which was enough for what I needed, but feel free to contribute and improve upon it 🙂
UPDATE: An updated version of this post is now available >> here <<.
Installation
You can clone the repo, or simply copy the files node.py and markovchain.py in the same directory as your script.
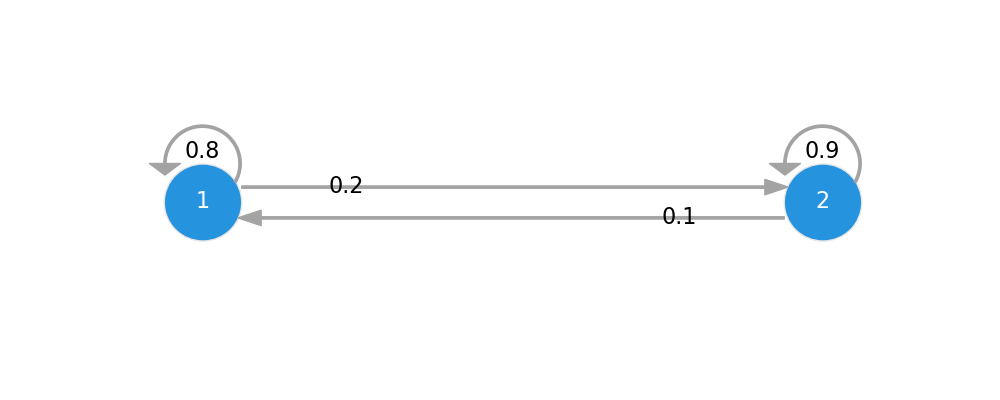
Two-State Transition Diagram
import numpy as np
import matplotlib.pyplot as plt

# Import the MarkovChain class from markovchain.py
from markovchain import MarkovChain

P = np.array([[0.8, 0.2], [0.1, 0.9]]) # Transition matrix
mc = MarkovChain(P, ['1', '2'])
mc.draw()
Will plot this
Three-State Transition Diagram
P = np.array([
    [0.8, 0.1, 0.1],
    [0.1, 0.7, 0.2],
    [0.1, 0.7, 0.2],
])
mc = MarkovChain(P, ['A', 'B', 'C'])
mc.draw()

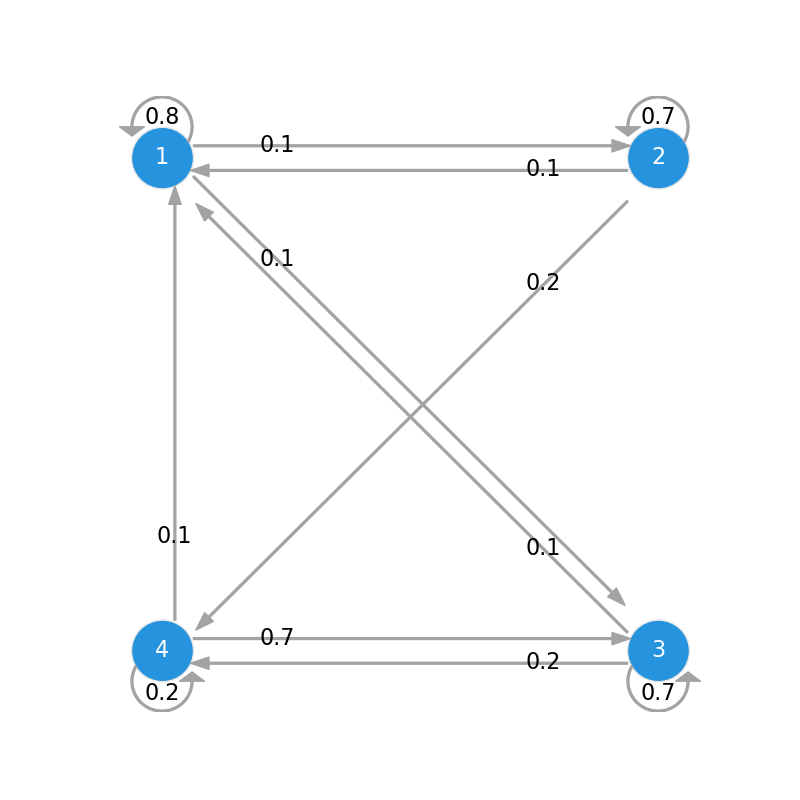
Four-State Transition Diagram
P = np.array([
    [0.8, 0.1, 0.1, 0.0],
    [0.1, 0.7, 0.0, 0.2],
    [0.1, 0.0, 0.7, 0.2],
    [0.1, 0.0, 0.7, 0.2]
])
mc = MarkovChain(P, ['1', '2', '3', '4'])
mc.draw("../img/markov-chain-four-states.png")
Full demo available here.