Again one of these things that maybe 100 other people will ever need to do in their lives. In case you are one of us though here is a short convenient Python class that will make your life easier 😀
EDIT: This script is now part of a package available through pip, so you can plot your coordinate system even faster! Details in this post.
import numpy as np
import matplotlib.pyplot as plt
from mpl_toolkits.axisartist import SubplotZero
class Axes():
def __init__(self, xlim=(-5,5), ylim=(-5,5), figsize=(12,5)):
self.xlim = xlim
self.ylim = ylim
self.figsize = figsize
self.__scale_arrows__()
def __drawArrow__(self, x, y, dx, dy, width, length):
plt.arrow(
x, y, dx, dy,
color = 'k',
clip_on = False,
head_width = self.head_width,
head_length = self.head_length
)
def __scale_arrows__(self):
""" Make the arrows look good regardless of the axis limits """
xrange = self.xlim[1] - self.xlim[0]
yrange = self.ylim[1] - self.ylim[0]
self.head_width = min(xrange/30, 0.25)
self.head_length = min(yrange/30, 0.3)
def __drawAxis__(self):
"""
Draws the 2D cartesian axis
"""
# A subplot with two additional axis, "xzero" and "yzero"
# corresponding to the cartesian axis
ax = SubplotZero(self.fig, 1, 1, 1)
self.fig.add_subplot(ax)
# make xzero axis (horizontal axis line through y=0) visible.
for axis in ["xzero","yzero"]:
ax.axis[axis].set_visible(True)
# make the other axis (left, bottom, top, right) invisible
for n in ["left", "right", "bottom", "top"]:
ax.axis[n].set_visible(False)
# Plot limits
plt.xlim(self.xlim)
plt.ylim(self.ylim)
# Draw the arrows
self.__drawArrow__(self.xlim[1], 0, 0.01, 0, 0.3, 0.2) # x-axis arrow
self.__drawArrow__(0, self.ylim[1], 0, 0.01, 0.2, 0.3) # y-axis arrow
def draw(self):
# First draw the axis
self.fig = plt.figure(figsize=self.figsize)
self.__drawAxis__()
#--------------------------------------------------------
# Main Code
#--------------------------------------------------------
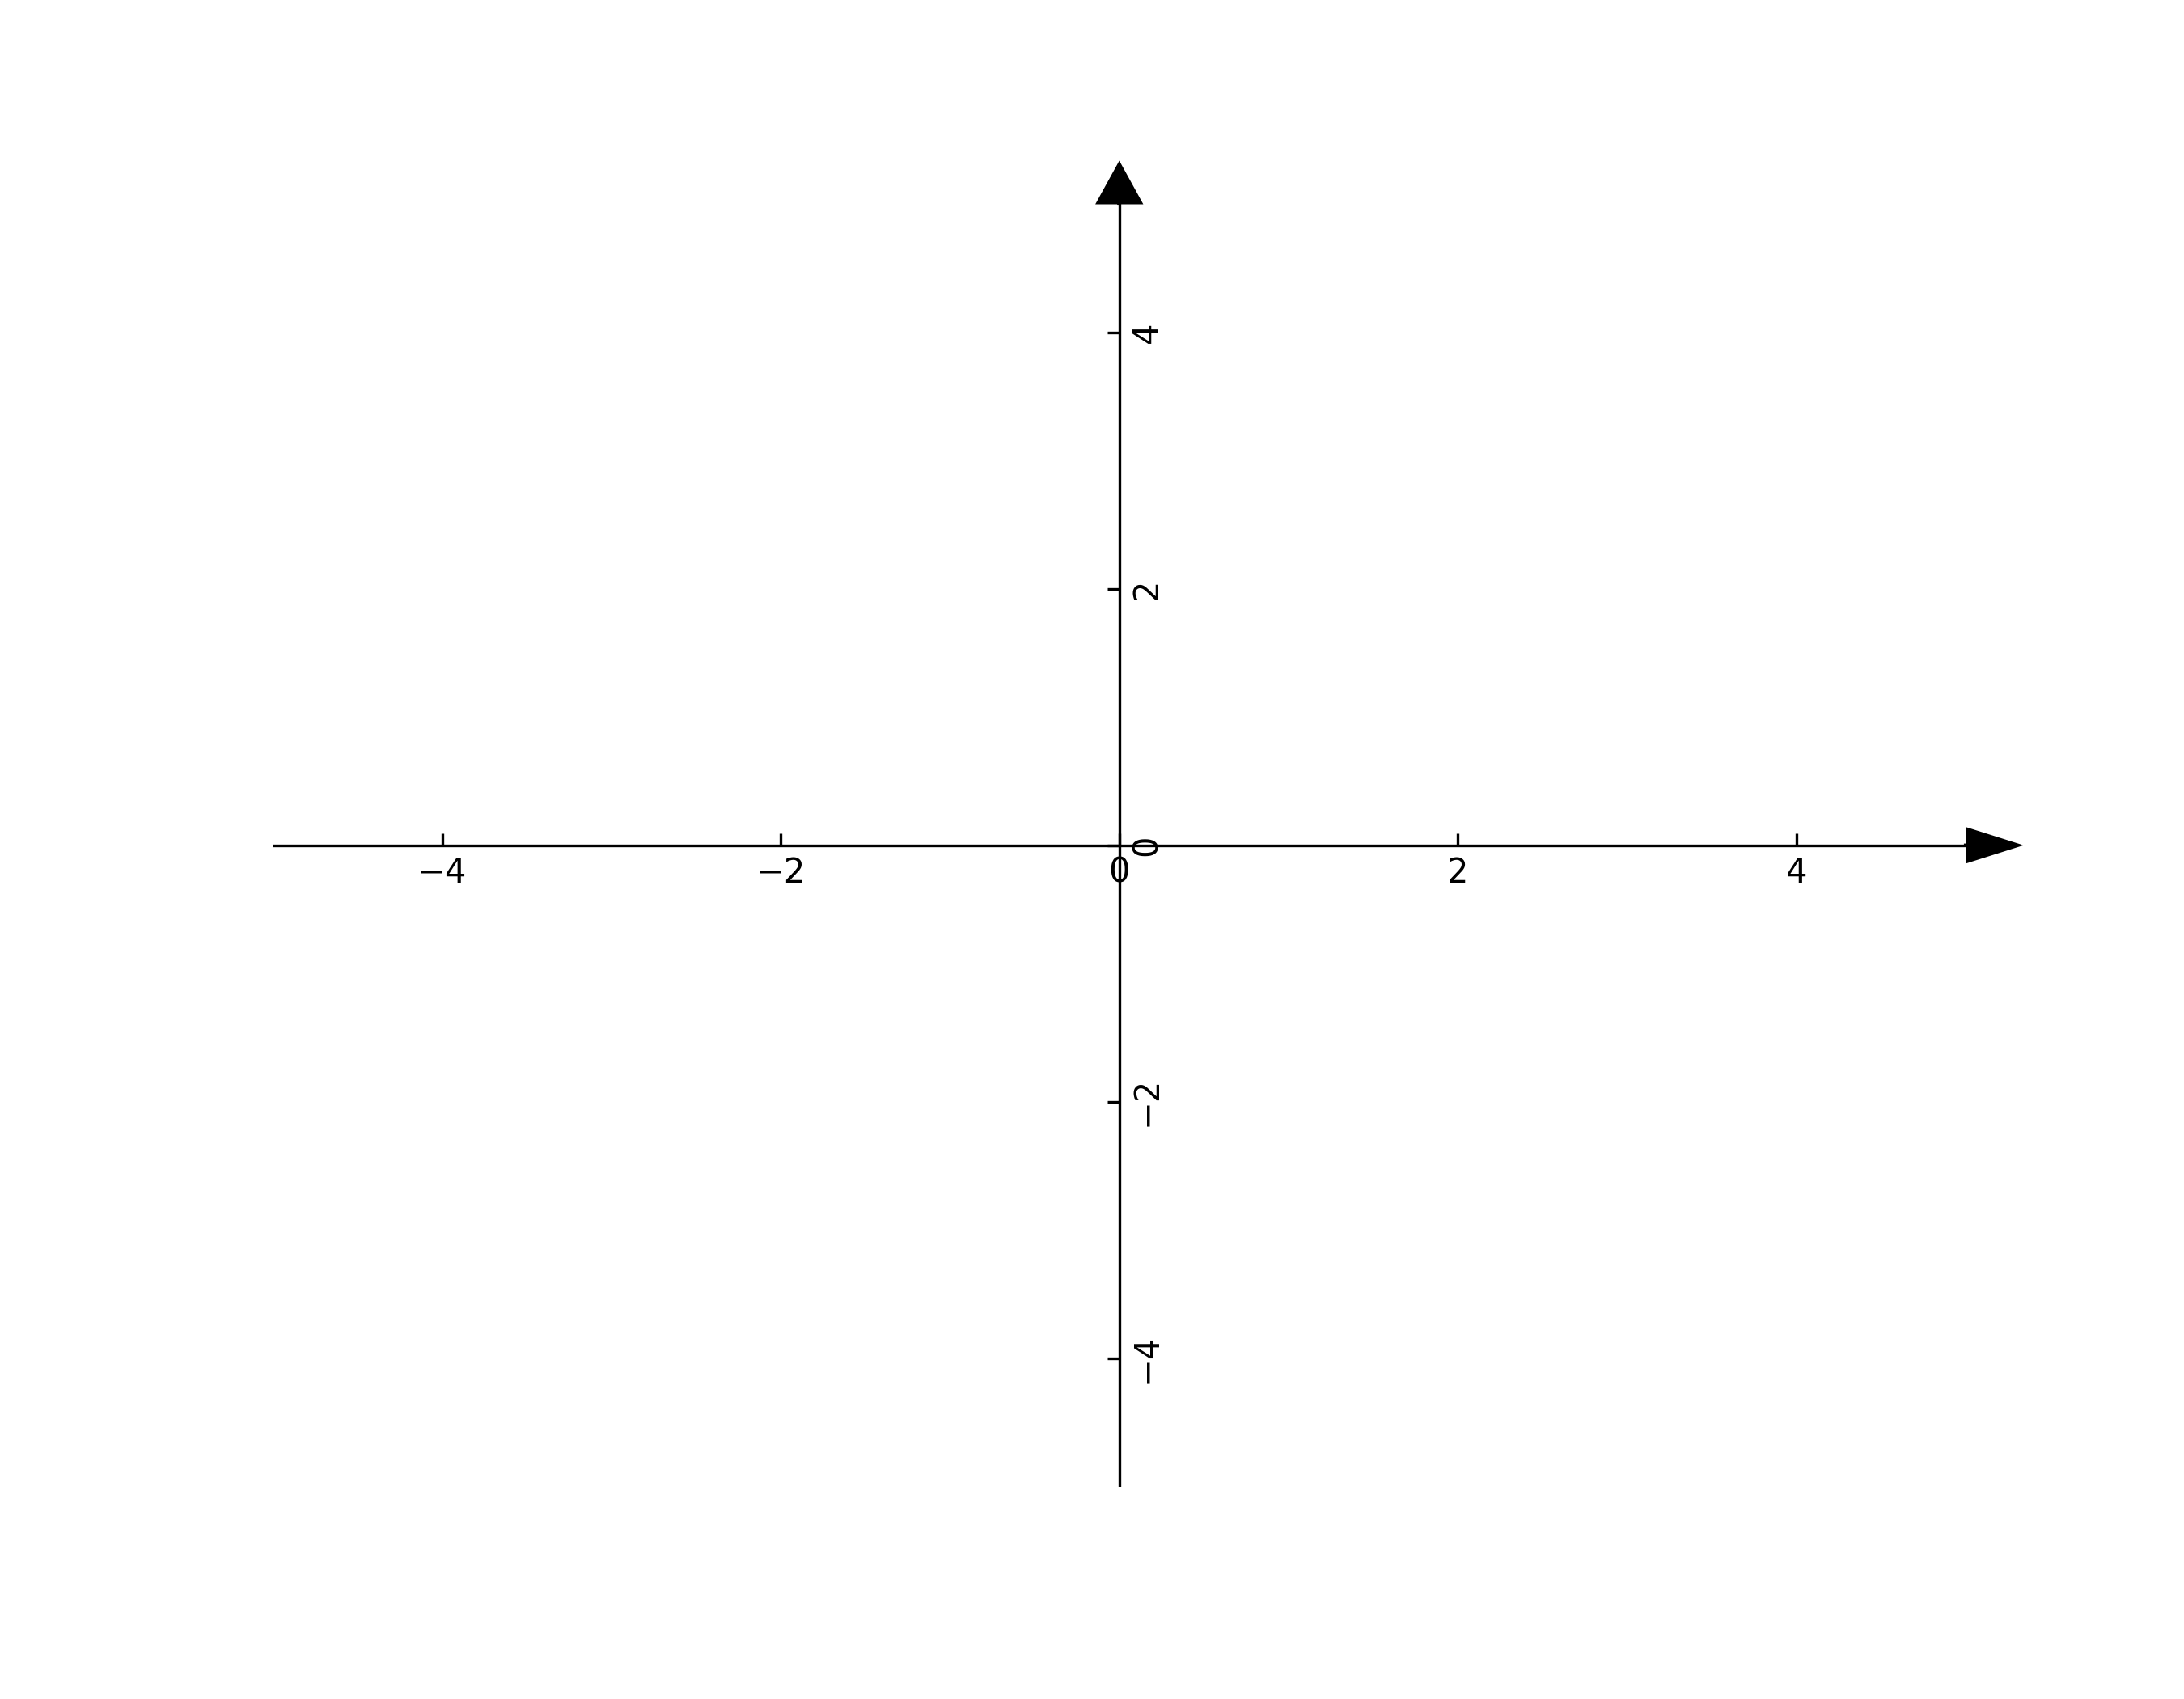
axes = Axes(xlim=(-5,5), ylim=(-5,5), figsize=(9,7))
axes.draw()
Which produces
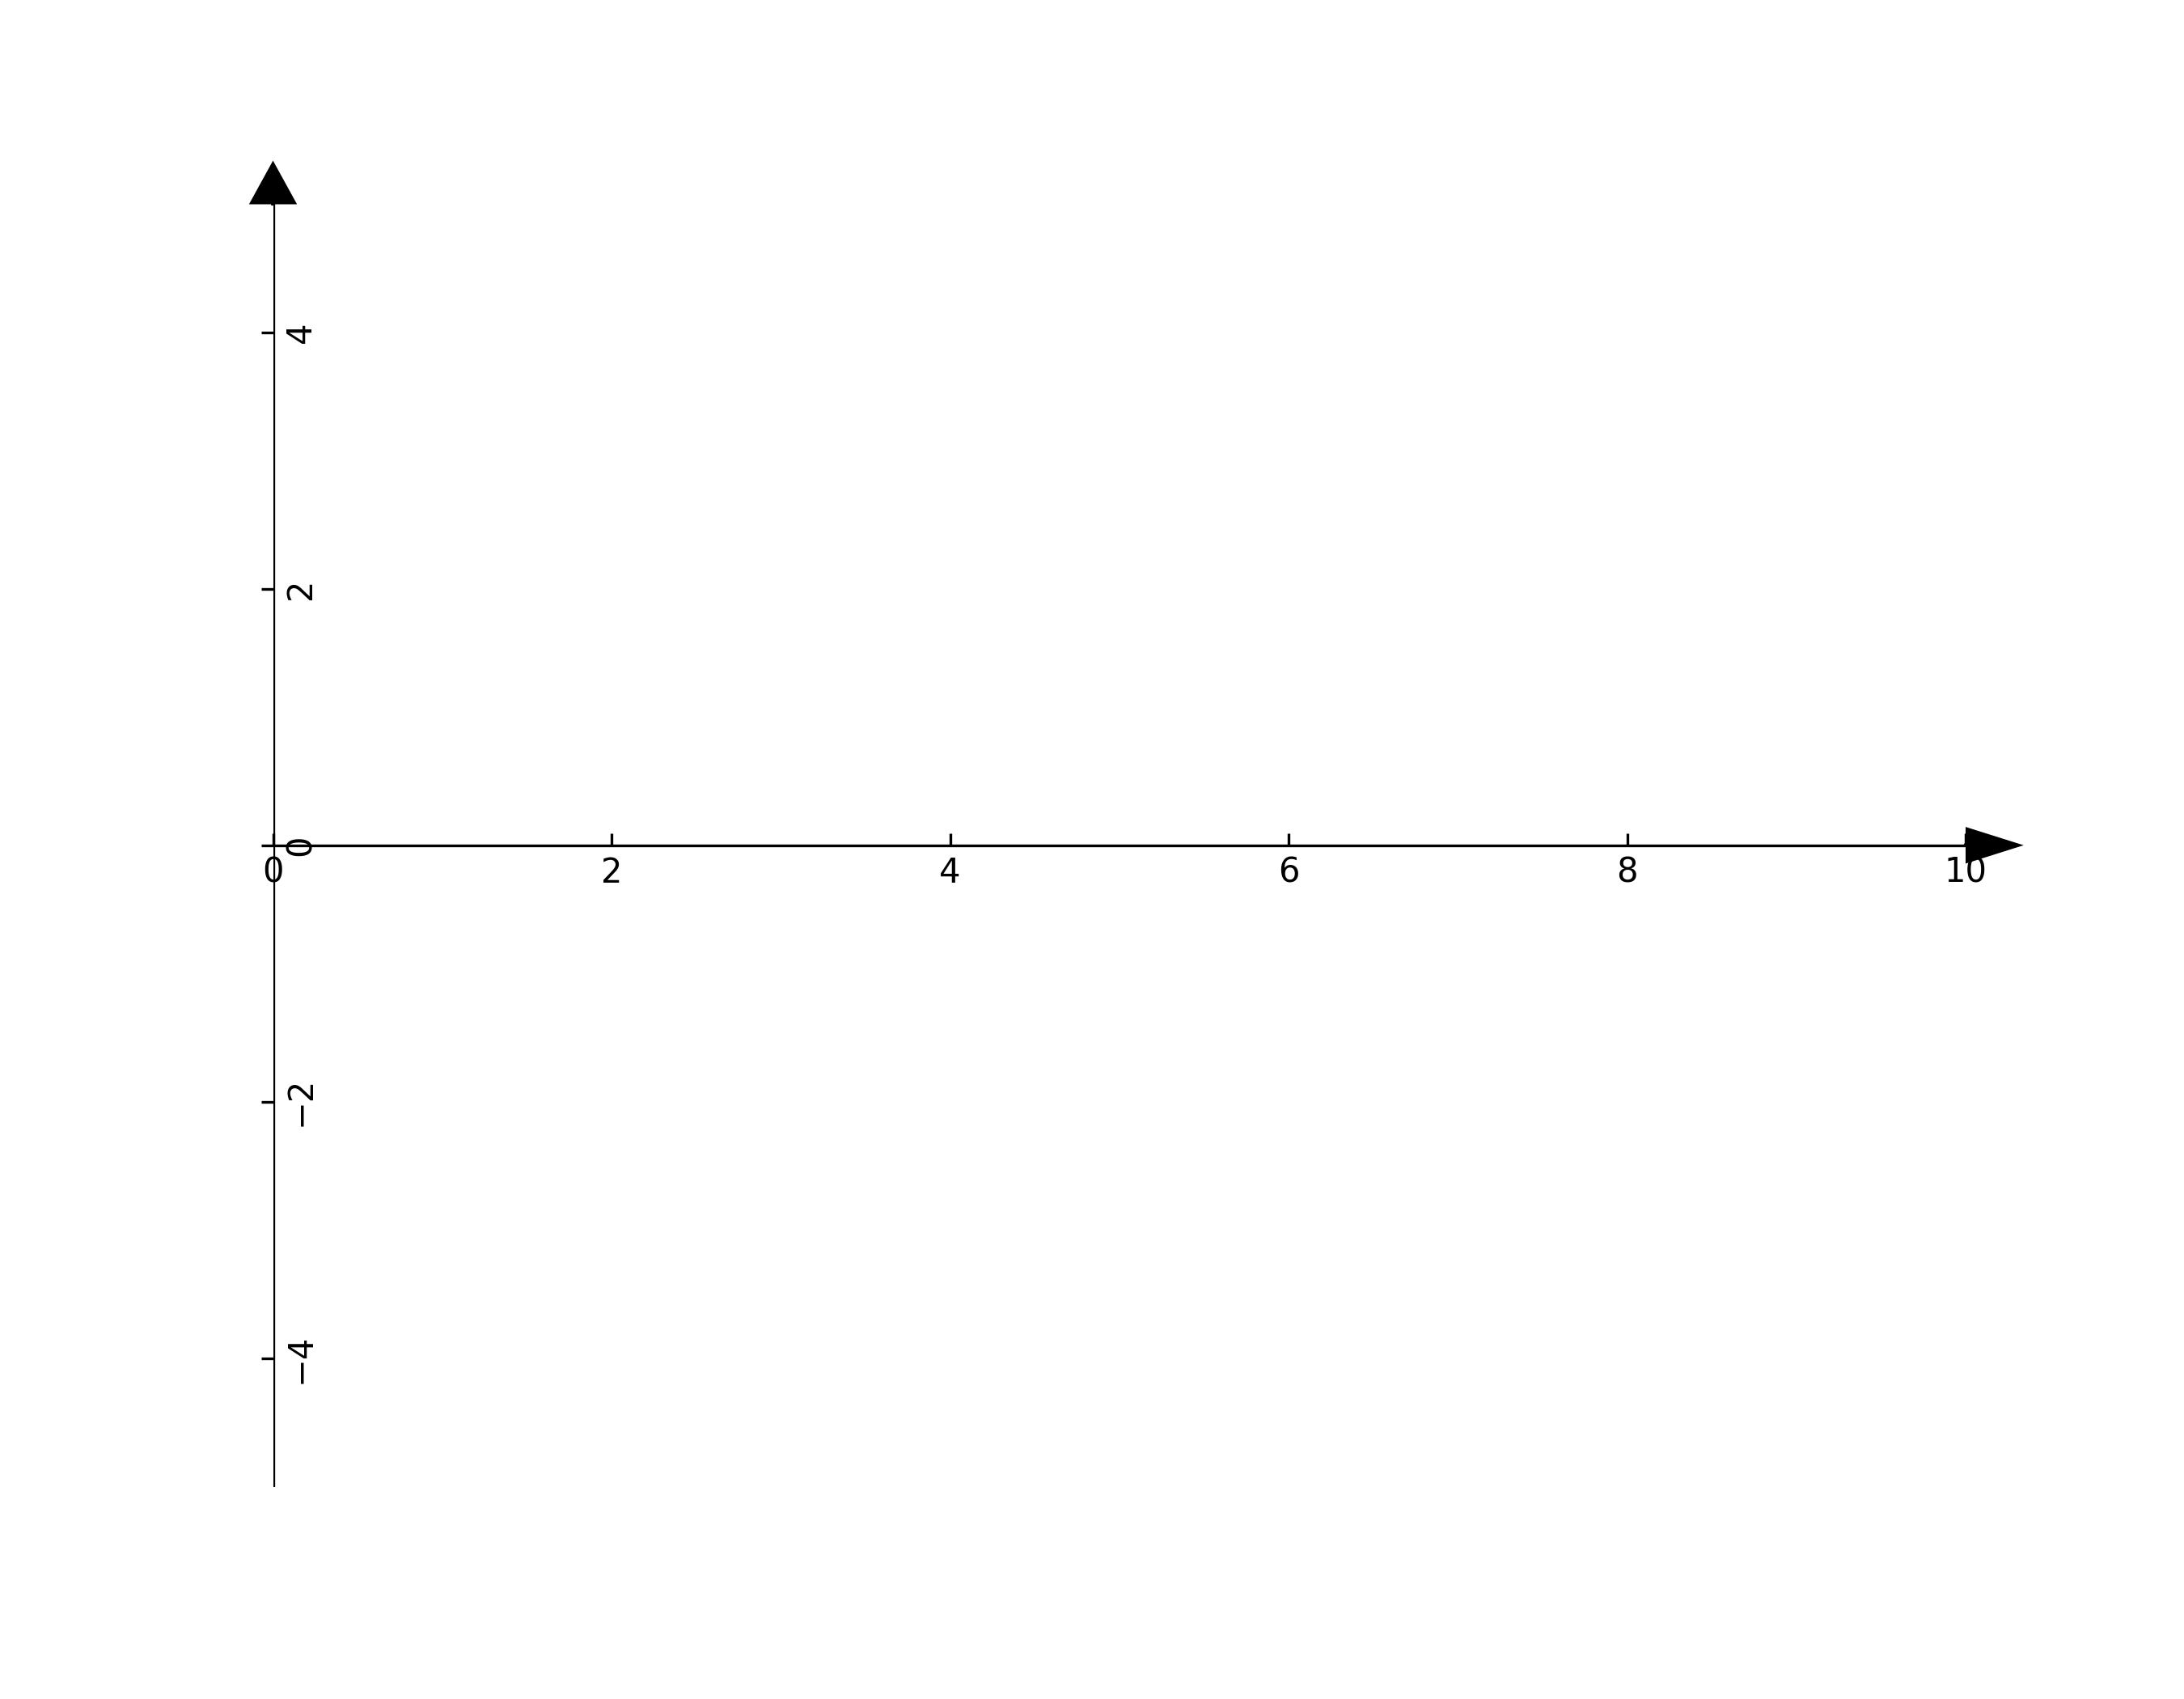
It is also very easy to change the axis limits
# Create the cartesian axis
axes = Axes(xlim=(0,10), ylim=(-5,5), figsize=(9,7))
axes.draw()